20
22
Integrated Project Controls & Digital Survey Insights
Foreword

Our annual survey is key to better understanding our industry and provides companies with a source of knowledge and data to continuously improve and develop. The response from this year’s survey has reinforced both challenges and opportunities, especially within digitalisation in the industry, that we frequently see form our clients.
Within this report, we have explored some topical themes and looked at how we can take these findings to provide the next steps for companies to become more efficient, productive, and successful. Digital technologies and systems will power the next wave of investment within the construction industry and has therefore been a key focus within this survey.
In response to this growing demand from clients and the industry, LogiKal formalised the ‘Digital Taskforce’ to invest in both the methodologies and services offered. This has ensured LogiKal are at the forefront of digital developments and thinking within the industry. It is nice to see the survey reinforcing the need for digital across the industry.
The Digital Taskforce has four key workstreams;
1. BIM and Information management,
2. Integrated Project Controls Solutions,
3. Data analytics and business intelligence,
4. Digital capability and training.
Thank you to everyone who contributed and provided useful insight into the industry. We hope you find this report both informative and useful in implementing the right next steps for your organisation.

Survey at a glance
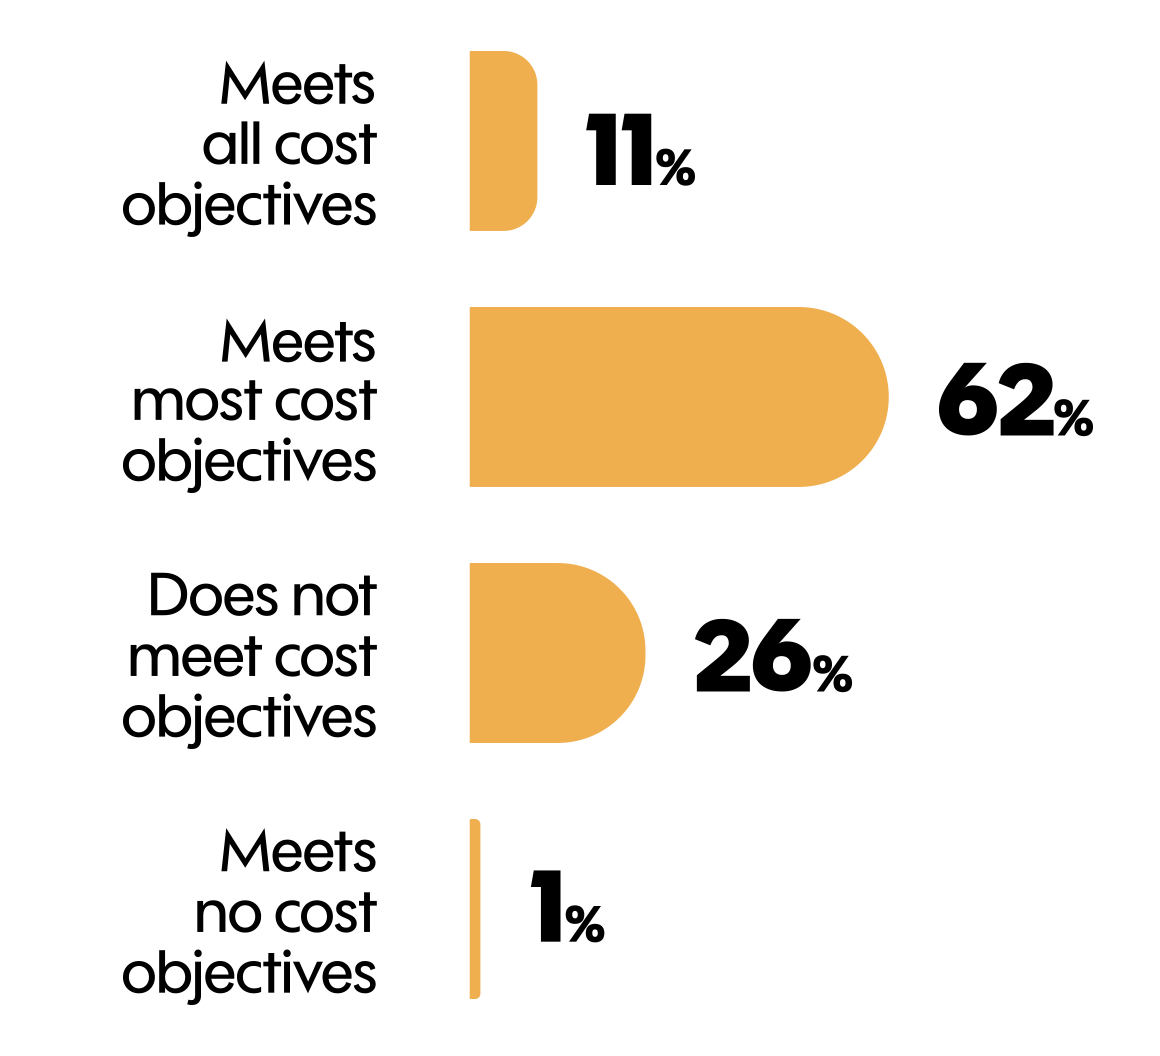
Percentage of projects and portfolios that meet all or most time, cost and quality objectives’


The data shows that respondents were generally confident that their project(s) and portfolios would be successful despite (20%) underperforming on time or cost objectives. This indicates that quality is of greater importance than time and budget when evaluating a projects’ success. This is perhaps unsurprising, especially after COVID-19, which will have impacted project/portfolios with delays and additional cost requirements.
KEY FACT
82% of projects and portfolios with skilled staff, integrated systems and clearly defined processes were successful.
To be more successful, projects must embrace and invest in three key elements: people, processes, and systems. When these three elements work in harmony, the project control function can provide accurate and timely information to help the smooth running of a project.
“Evolving our project control capabilities has never been as important as it is today in enabling successful project, programme and portfolio (P3) delivery. In a world that is focused on digitisation, automation and AI, coupled with an increasing importance on having strong project data analytics capabilities, it is fundamental that we recognise our project controllers’ need to adapt for the future in terms of their skills and competencies. Improving the recognition on the criticality of their role in P3 delivery across organisations is essential.”
Sue Simmonite
Global Project Management & Control Director BAE Systems plc

‘Project controls should account for 5% of project value’
Project controls account for only a small part of the overall budget, but with big implications. The target of project controls is to keep costs and schedules as close to the original baselines as possible whilst monitoring, tracking, and reporting any variances, detecting problems early, and providing decision-makers with the right information to take decisive action. This decisive action paves the way for a strong Return On Investment (ROI) by saving time and money throughout delivery.
Digital Technology
& Innovation
A digital delivery plan is crucial for succeeding in today’s ever demanding and evolving industry. Getting this set up can be a simple process if you follow these rules. LogiKal have helped many major projects around the globe successfully implement digital innovation and transformations. We find that setting this up can be a simple process if you follow these rules.

Engaging with key stakeholders
No plan will be successful without the right backing. Getting stakeholders involved, especially the executive leadership, early on in the process will ensure the plan is supported by the client and management teams on the project. Getting this input early will also help to identify any issues/ conflicts before rolling out the plan. The executive leadership are critical stakeholders to get on board in this process.
Be realistic with your goals
Setting something unachievable will demotivate the team and can cause issues further down the line.
Focus on the most critical areas
You can’t do everything at once, so
identify what is the most beneficial for
your project(s) and make that the starting point. Performing an audit will help you understand the current situation and
where you would see the most benefit.
Think of the future
While no plan can be completely future proof, there are ways to ensure the plan will develop appropriately with the goal and market in the future.
Make the investment
Having an appropriate budget set aside to achieve these goals will be critical in achieving long term success. You cannot expect top results without making the investment.
Do your research
There are lots of options for delivering a digital plan, so understanding the market and what is already being done will help you with your own plan.
76% of projects with a digital delivery plan are confident in time, cost, and quality outcomes.

Having a robust plan in place for your digital delivery will be critical to succeeding, but this does not have to be done on your own. An initial assessment will be a first step in identifying your project or portfolio’s weaknesses and opportunities; following this a digital improvement roadmap can be developed. Often having an external view and consulting experts, who have access to industry benchmarking data, can provide you with a robust and clear view of how to improve your current position.
KEY FACT
Over half of projects do not benchmark project controls data against their own or other industries.
KEY FINDING
Projects and portfolios that do not benchmark their project controls are 80% more likely to fail meeting objectives.
Building Information
Modelling (BIM)
BIM (Building Information Modelling) is a methodology that combines policies, processes and technologies to manage the information of construction throughout its life cycle through models based on 3D objects.
With the increasing demand and availability of digital technology in construction, it is unsurprising that BIM has remained a key focus for companies over the last few years. Despite this, there is a surprisingly high number not using BIM at all.
When looking at the blockers to increasing BIM maturity, lack of in-house experience and high cost were the top two reasons, which is a reoccurring trend that we see year on year. This indicates the need for more digital training and upskilling for staff. See the skills and capability section on page 18 for more detail on this topic.
In the regions of Asia and North America, resistance to change is cited as the main blocker. To overcome this, project(s) should engage with stakeholders to understand the resistance. This also reinforces the importance of getting stakeholder engagement early in the process and how this should be used to assist managing the change process.
Overall, lack of client demand was considered the least important blocker by respondents, which shows clients do at least have an interest, if not a demand, for increased BIM maturity. This aligns with the increasing demand we have seen with our clients, which is helping to move the industry forward.
KEY FACT
79% of projects and portfolios executing a BIM Execution Plan with well-defined BIM stages were successful. This is roughly 1.5x more than those that do not have a plan or roadmap.
79%
Level 3 – Wholly integrated information model across the project, with team working collaboratively in real-time 10%
Level 2 – Models are shared between the project team using a common data environment 34%
Level 1 – Use of 3D & 2D CAD for documentation and works information 24%
Level 0 – Basic 2D CAD use and minimal collaboration 10%
No BIM – Information is generated manually by hand 22%
BIM usage year on year
To understand where the gaps and opportunities are to advance your BIM maturity, a discovery review and execution plan with a clear roadmap will be key. Not only will this identify the strengths and weaknesses, but can also motivate the project team and develop their current skills and knowledge to meet future organisational requirements. Having an outside party able to draw upon industry best practices and benchmarking capabilities to provide a common framework for assessing and improving digital engineering can be hugely beneficial.
4D & 5D
BIM
Over the last several years, 4D Planning and 5D BIM have been a fast-growing trend within projects and programmes and will continue to make a significant contribution to project development and delivery.
4D Planning Definition:
4D planning enhances the way we visualise project planning information by combining 3D models with the dimension of time (planning). Amongst other benefits, 4D Planning helps visualise progress performance and manage site logistics throughout delivery.
Used frequently – 11%
Periodically – 17%
Occasionally – 19%
Not used, but intend to within 12 months – 21%
Not used, do not intend to – 33%
5D BIM Definition:
5D BIM is a step further than 4D with the additional dimension of cost as well as time. It provides the benefit of further integration, allowing greater data alignment and stronger efficiencies throughout project development and delivery.
Can provide 5D visual feedback for cost and schedule – 4%
Can integrate some cost, time and 3D models – 20%
Not used, but intend to within 12 months – 19%
Not used, do not intend to – 48%
Success with different levels of 5D BIM usage
When looking at some of the main obstructions to increasing 5D BIM uptake differ from those related to general BIM Maturity.
The lack of project leadership support to uptake 5D BIM is a sign that the mass adoption of these tools is still in early stages, and a cultural shift is still required. The integration of costs in the building models and visual planning tools is a step towards transparency that challenges the usual protectiveness of budget and cost information among stakeholders of a project. Only by overcoming this will it drive greater collaboration on Projects and across Industry as a whole.
Key blockers for increased uptake in 5D BIM
1. Project Leadership
2. Client Demand
3. IT Systems
Data Analytics and
Business Intelligence
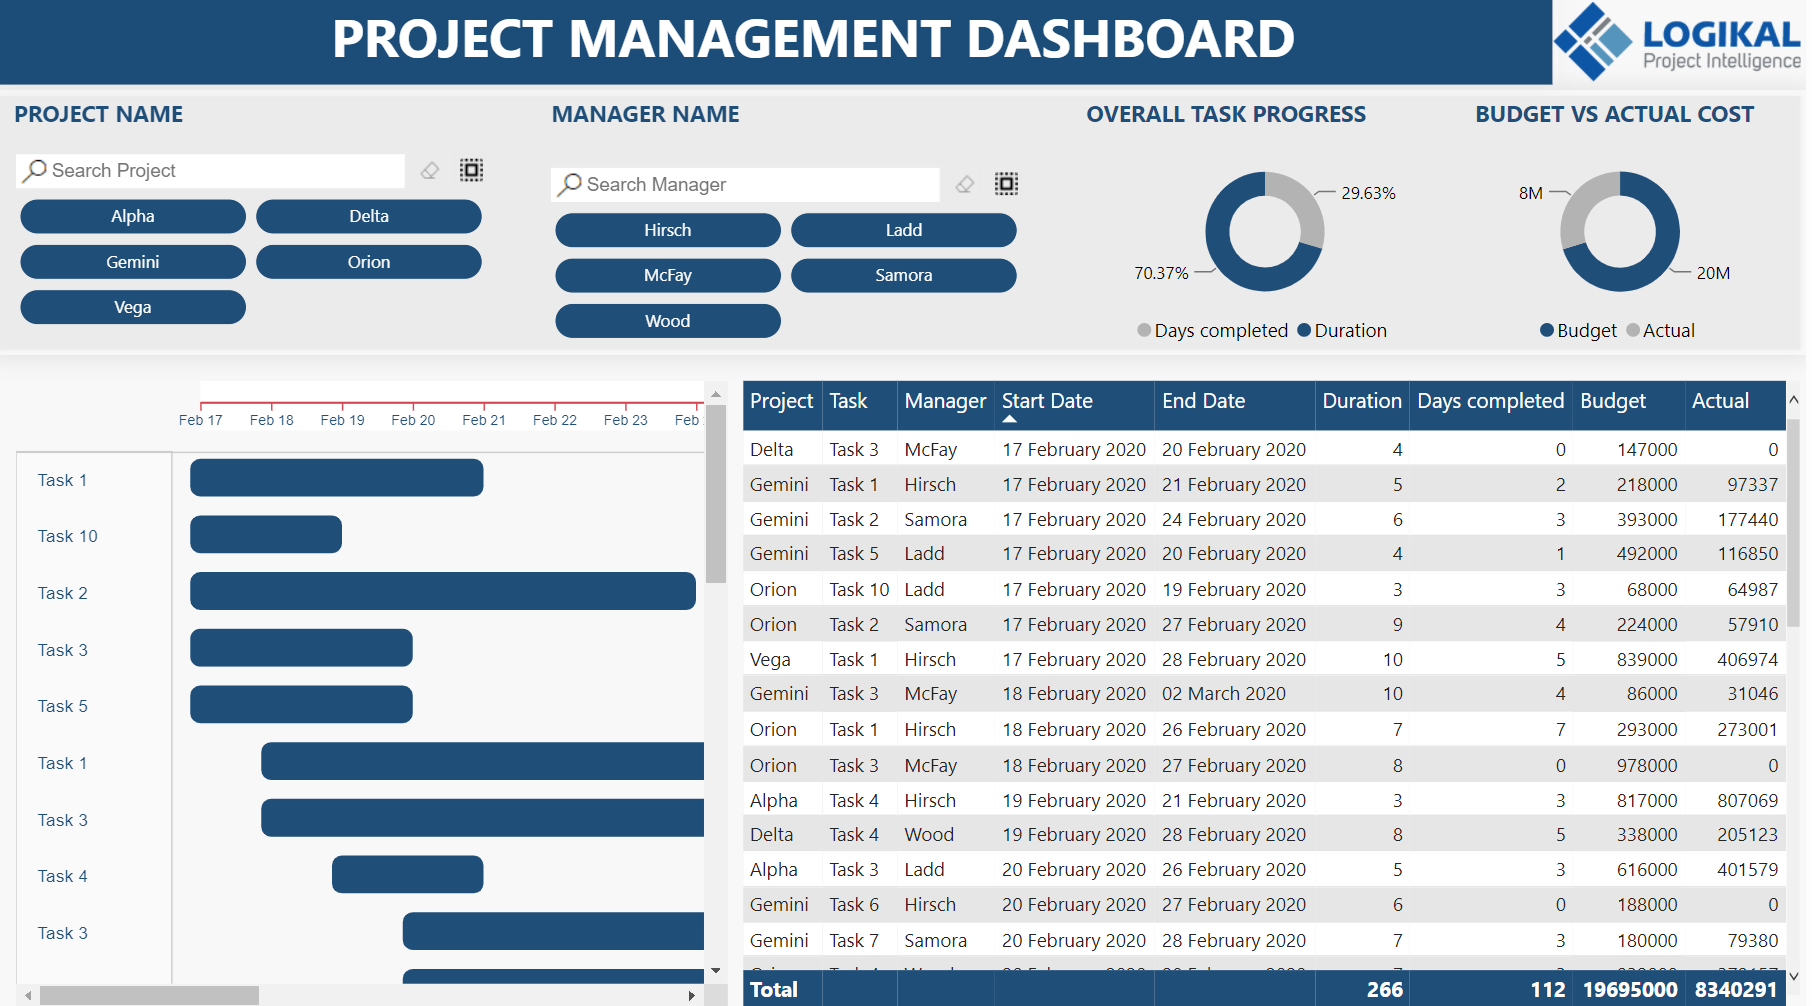
Reporting and dashboards are key tools to successful project delivery and are often the most visible element of the project controls function. However, a dashboard can only ever be as good as the data that feeds it.
The process of creating a dashboard is relatively straightforward, it is establishing a single source of truth through reliable data that often poses the bigger challenge. This year, there was a 9% increase in companies using BI tools compared to last year. This increasing reliance on BI tools fits with what we have seen with clients and the increasing desire to have smarter dashboards for a better understanding of the data. When looking at this by industry, we can see some major increases in BI tool usage.
Industries that have increased BI tool usage in the last year
Mining
1.85x
Commercial / Residential Retail
1.4x
Civil Infrastructure
1.15x
Only 5% of projects have fully automated data processing, however, of this small group there was a very high success rate 79%. Automation of data processing is therefore key for businesses to succeed and will be a growing area of development across the industry.
KEY FACT
Projects and portfolios that have fully automated data processing (with no human handling) were 1.6x more likely to meet their objectives.


Success rate based on time spent gather data vs analysing results
To ensure successful and effective data analytics and business intelligence, project(s) need the ability to have data processing fully or mostly automated. This will free up time to analyse what the data is saying, rather than collecting the data, which supports better decision making. This has been demonstrated as projects and portfolios that spend 80% of the time analysing data and only 20% of time collecting data were 1.4X more confident in achieving project outcomes compared to those that spend 80% of time collecting data.
Integrated
Project Controls
Integration of your project controls is crucial to success. Our survey showed project and portfolios are 3.8x more likely to fail without full integration of systems and processes.

1. Discovery:
Where the majority of the work is done and the success of the project is won
2. Implementation:
Don’t let perfect be the enemy of good.
3. Acceptance:
Ensure you have done thorough testing at this point.
4. Migration / Roll out:
Get staff to be hands on with the system early on.
5. Next Steps:
Make sure you close the loop with ongoing development.
During each stage, there are key considerations and agreements that need to be pre-defined. Take time in the discovery phase to not only get stakeholders onboard but establish the exact requirements; at the end of this stage you should have sign off on your delivery plan.

Top 3 benefits of integrated project controls systems

1. Better efficiency

2. Enhanced decision making

3. Improved predictability
KEY FACT
1 out of 4 projects uses Microsoft Excel for Cost and Risk related functions
KEY FINDING
1 in 3 projects use Microsoft Office software (Power BI excluded) for Change and Reporting functions
Skills &
Capability
Year on year, our survey has shown a gradual but steady increase in the level of skill within the industry. This is an important and significant observation for the industry which has been struggling with a skills shortage for many years. This demonstrates that the support and training which has been increased in this sector is having a positive impact on the workforce.
Teams that have most or all skills to perform their functions successfully.

Our survey showed that there was a larger need for projects to upskill in the technical areas with common focuses being on:
Software and Tools
Project Controls and PM Fundamentals
When looking at soft skills, respondents felt the key areas to upskill are
Oral / Written Communications
Influencing Skills
KEY FACT
Projects where training is considered unimportant, are 1.75 x more likely to fail.
There was a positive correlation between the respondents that perceived a lack of opportunities for training in the industry and those indicating a low focus on capability development by their companies. For companies to create a positive change for staff, a clear focus on development and training will be critical.
Success Rate with Staff Proficiency: Technical vs Soft Skills
For organisations to successfully upskill their staff, a common and successful methodology to apply is the Learning & Development Model. This implies that companies should dedicate 70% of upskilling with hands-on experience on a project, 20% should be learning through others/ mentorship and 10% should be formalised learning/ training. This model is widely adopted in Learning & Development and studies have found in organisations that have implemented this model, it has had a positive impact on staff behaviour allowing them to put what they have learned into practice quicker. LogiKal often adopt this method with clients to ensure project and portfolios are set up for success.
Hand-on experience – Learning through others – Formal training
Diversity &
Inclusion
The construction industry has long been seen as a traditional and male dominated sector, and our survey showed that 23% of projects and portfolios have 20% or less female staff in the team. The 2 industries that were better in gender diversity were utilities (water and power) and the public sector. Our survey also showed a notable difference between different organisation types. Consultancy and Client/Owner organisations were twice more likely to have 40-60% female staff compared to Contractors.
% of organisation types that have between 41-60% female staff
41%
Consultancy
31%
Client/ Owner
16%
Contractor
Similar to our previous years survey results, the perception of a heavily male-dominated industry and the lack of female applicants were considered the main reasons preventing an increase in gender diversity.
Although very close to each other in overall %, lack of female applicants ranked higher among Clients/Owners and Consultants, while the perception of heavily male-dominated industry ranked as the top blocker among Contractor-side respondents.
Diversity is not just about gender, and in this year’s survey, we broadened our questions to look at some other key areas surrounding the topic of diversity and inclusion such as LGBT+ diversity and disability in the workplace.
So what can companies be doing to break down these perceptions of a male-dominated industry and create a more inclusive and attractive environment for staff? The most important aspect of creating a safe working environment is to recognise bias and call out inappropriate behaviour. Embedding these into everyday working practice within an organisation will start to create a safe space for employees to feel heard and valued for their differences. This is true for not just creating a gender diverse workplace, but diversity more broadly too.
There is much to be done in building a diverse, inclusive and welcoming environment across the construction industry. For us to achieve this as an industry, we need to work together and harness our collective power to drive LGBTQ+ inclusion.
Building Equality, London Region

The drive for an inclusive and diverse workforce is generally perceived as a catalyst for innovation due to the variety of perspectives that it brings. Other aspects such as faster problem-solving, better decision making, and improved business culture were also ranked as important benefits of Diversity.
Although there are some positive outlooks on diversity in the survey, there is still much room for improvement in the industry as a whole. There are many construction LGBT+ groups (voluntarily run) which build a network for professionals to meet, share company best practices and drive the way forward for LGBT+ inclusion. LogiKal is a member of Building Equality which allows SME’s and large organisations alike to learn and share to build better, more inclusive work environment.
KEY FACT
60% of companies promoted or supported LGBT+ inclusion.
KEY FINDING
64% of companies promoted or supported Disability inclusion.
Projects/portfolios with less than 20% female staff were 1.4x more likely to fail in meeting objectives.

Benefits of diversity are:
1. Variety of perspectives

2. Innovation
3. Better business culture
Sustainability
For many years, the issue of sustainability has been at the forefront of the construction industry. It has become an integral part of how infrastructure is designed, built and how companies operate.
In this year’s survey, we evaluated how the Project Controls and PMO functions are involved in sustainability initiatives.
The primary way that the PMO or project controls function are currently involved in sustainability initiatives is through capturing and reporting related data or by setting up integrated processes and sustainability-related standards.
Of those respondents who provided their view on which Sustainability Initiatives PMO and Project Controls functions are best placed to support, the majority considered that all initiatives require PMO and Project Controls participation to a certain degree. Common answers for how the PMO / Project Controls function could get involved in sustainability initiatives included tracking of carbon footprint data and targets relating to Lean and Waste reduction.
The predominant approach to sustainability from the Project Controls function has been focused on limited aspects, such as monitoring environmental indicators. However, recent trends support the view that the general functions of project control can and should be adjusted to account for all sustainability dimensions (social-economic). This will have to reflect first in project governance, as further integration, proactivity, and collaboration between parties are required.
KEY FACT
Only 25% of projects and portfolios have the project controls or PMO function involved in the organisation’s sustainability initiatives.
Conclusion &
Survey Highlights

1. Investment:
Project controls should account for 5% of project value.

2. Digital:
76% of projects with a digital delivery plan are confident in achieving overall success and are meeting most of the project’s time, cost, and quality objectives.

3. BIM:
Projects and portfolios using BIM are 48% more successful than those without any BIM.

4. Integration:
Project and portfolios are 3.8x more likely to fail without full integration of systems and processes.

5. Software:
1 in 3 projects use Microsoft Office software (Power BI excluded) for Change and Reporting functions.

6. Data Analytics:
Only 5% of projects have fully automated data processing, however, of this small group, there was a very high success rate 79%.

7. Skills and Training:
Projects where training is considered unimportant, are 1.75 x more likely to fail.

8. Gender Diversity:
Projects/portfolios with less than 20% female staff were 1.4x more likely to fail in meeting objectives.

9. LGBT+ Diversity:
60% of companies promoted or supported LGBT+ inclusion.

10. Sustainability:
Only 25% of projects and portfolios have the project controls or PMO function involved in the organisation’s sustainability initiative.